Look, there was a time when I couldn't read. At that point, I didn't go around telling people that the words they were reading were wrong, even though I was a complete idiot. I knew I was illiterate, although I wouldn't have used that term, so I didn't try and talk about things I had no idea about.
If the statistically illiterate could also follow that principle, that would be great. Though at least they're showing that Messrs Dunning and Kruger were correct.
LoveNotHate wrote:
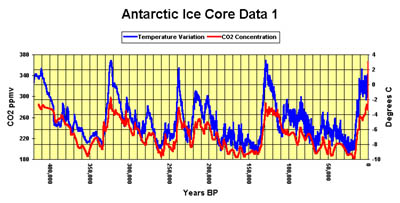
How could we know how much atmospheric CO2 there was before humans existed ?
Humanaut wrote:

No cyclical activity on a geological time scale, though.
Isotope ratios. ThetaIn3D has already explained some of them, but I think the organic ones are cooler:
Quote:
Isotope geochemists have developed time series of variations in the 14C and 13C concentrations of atmospheric CO2. One of the methods used is to measure the 13C/12C in tree rings, and use this to infer those same ratios in atmospheric CO2. This works because during photosynthesis, trees take up carbon from the atmosphere and lay this carbon down as plant organic material in the form of rings, providing a snapshot of the atmospheric composition of that time. If the ratio of 13C/12C in atmospheric CO2 goes up or down, so does the 13C/12C of the tree rings. This isn?t to say that the tree rings have the same isotopic composition as the atmosphere ? as noted above, plants have a preference for the lighter isotopes, but as long as that preference doesn?t change much, the tree-ring changes wiil track the atmospheric changes.
Sequences of annual tree rings going back thousands of years have now been analyzed for their 13C/12C ratios. Because the age of each ring is precisely known** we can make a graph of the atmospheric 13C/12C ratio vs. time. What is found is at no time in the last 10,000 years are the 13C/12C ratios in the atmosphere as low as they are today. Furthermore, the 13C/12C ratios begin to decline dramatically just as the CO2 starts to increase ? around 1850 AD. This is exactly what we expect if the increased CO2 is in fact due to fossil fuel burning. Furthermore, we can trace the absorption of CO2 into the ocean by measuring the 13C/12C ratio of surface ocean waters. While the data are not as complete as the tree ring data (we have only been making these measurements for a few decades) we observe what is expected: the surface ocean 13C/12C is decreasing. Measurements of 13C/12C on corals and sponges ? whose carbonate shells reflect the ocean chemistry just as tree rings record the atmospheric chemistry ? show that this decline began about the same time as in the atmosphere; that is, when human CO2 production began to accelerate in earnest.***
Source